by Prof. Dean R. Wheeler, Brigham Young University
EDITOR’S NOTE
This posting is reprinted from the original article written March 13, 2019 with permission from the author. This article was intended for chemical engineering students to size relief valves for pressure vessels, but it applies well to amateur liquid rocketry as many use a pressure fed system to deliver propellants to the engine.
The PDF of this white paper can be found below.
https://www.et.byu.edu/~wheeler/Tank_Blowdown_Math.pdf
The RRS has several members engaged with liquid rocket projects. An important part of analyzing the performance of those systems is the pressurization system that drives the propellant into the engine. The tank blowdown problem is useful to designing the system and estimating performance. This derivation goes through the thermodynamics of the general tank blowdown problem and should be a useful starting point for a pressure-fed liquid rocket project.
INTRODUCTION
This document provides a mathematical model for computing the rate of expelling gas through a small orifice or nozzle attached to a tank. Furthermore, two models are described for how fast the tank will depressurize. Related material on compressible flow can be found in fluid mechanics and thermodynamics textbooks and web pages.
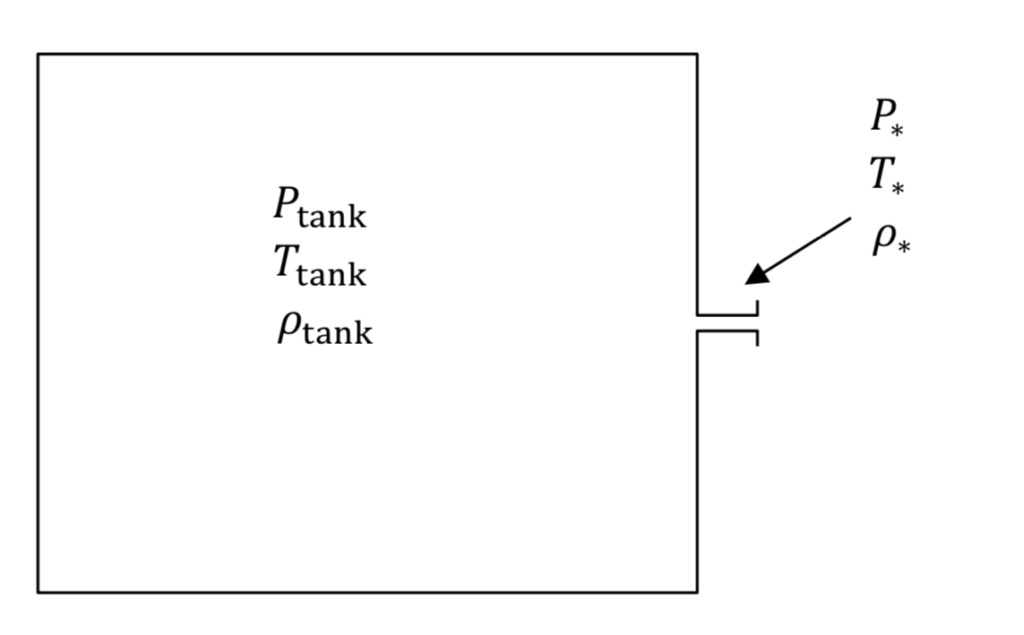
Figure 1 shows the tank and associated nozzle. The narrowest diameter of the flow path in the orifice or nozzle is known as the throat region. The tank and throat regions are described with their own sets of equations.
Provided the tank is large and the throat is small, it will take many seconds to empty the tank and gas velocities in the main part of the tank will be much smaller than the speed of sound. This means that gas pressure, temperature, and density in the tank will be spatially uniform, though they will be changing in time. Thus, we describe the tank using a transient mass balance. One can compare this to a model in heat transfer known as lumped capacitance.
In the nozzle region however, gas velocity is large and there are large spatial variations in the gas properties. In addition, there is relatively little gas contained in the nozzle region. Thus, flowrate in the nozzle adjusts rapidly to match current conditions in the tank, making it seem as if the nozzle is operating at steady state. This approximation for the nozzle is known as quasi-steady state.
EQUATIONS OF STATE
The P, T, and rho variables in Figure 1 denote absolute pressure, absolute temperature, and density in the tank or the narrowest part of the nozzle or throat (denoted by an asterisk,*, subscript), respectively. Note that if tank pressure is given experimentally as a gauge quantity, it must be converted to absolute to be used in the equations below.
The first relationship between gas variables is given by an equation of state. The ideal gas law is a fairly accurate representation for air when pressure is less than around 10 atmospheres or 150 psia. It states that:
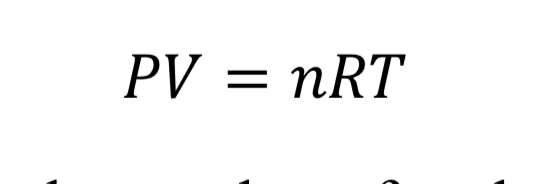
where “V” is the volume of the gas, “n” is the number of moles, and “R” is the universal gas constant (8.31446 J/mol/K). With the introduction of the molecular weight, M (effectively 0.028964 kg/mol/K for air), and the substitution that density is mass over volume, rho = n M / V, the ideal gas law is changed to
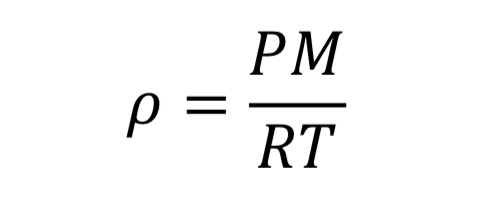
This equation could be applied separately to the tank variables or to the thrust variables.
TEMPERATURE AND PRESSURE DURING EXPANSION
The second important relationship comes from figuring out what happens when gas in the tank or nozzle expands. When a gas expands, its internal energy is used to perform work on the surroundings, and the gas therefore tends to cool off. If the gas expands slowly, there is time for itmto absorb hest from its warmer surroundings and the expansion is essentially isothermal, meaning the temperature stays at its initial value or that of the surroundings.
On the other hand, if a gas expands quickly its temperature will drop dramatically. This is called adiabatic expansion, where adiabatic means no noticeable heat transfer from the surroundings (i.e. the walls of the tank). In adiabatic expansion, the pressure drops more rapidly than it would for an isothermal (slow) expansion. Adiabatic expansion could haolen inside the tank if it is emptying rapidly, but this depends on the relative sizes of thr tank and nozzle. On the other hand, adiabatic expansion certainly occurs when a gas moves from the tank through the nozzle region. In other words, here the gas is moving quickly and therefore expanding quickly.
The thermodynamic relationships for pressure and temperature for reversible adiabatic expansion of a constant heat capacity ideal gas are:
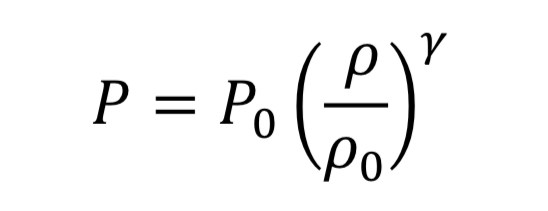
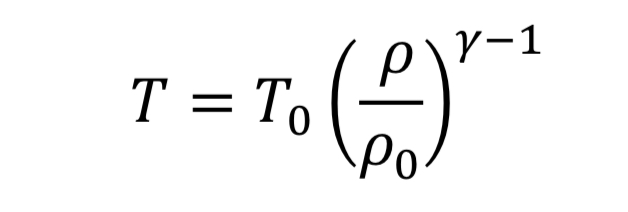
where the subscript, “o” indicates the initial state of the gas before the expansion started. This means if we know how the density is changing from an initial state to some later state, we can compute P and T as well. In the case of the nozzle, we apply the above equations as the gas travels between the tank and the throat. In the case, they become


The parameter, “gamma” , is the dimensionless ratio of specific heats ( gamma =. Cp / Cv ), and by statistical theory of gases, gamma = 7/5 = 1.4, for low temperature diatomic molecules, nitrogen (N2) and oxygen (O2) and so that value is used here.
CHOKED FLOW
Next, we need to determine the gas density in the nozzle when the tank is at a specified conditions. Recall that that the nozzle is treated as if it instantaneously responds to whatever state the tank is in. A fuller discussion of the nozzle flow equations can be found in other sources like textbooks that cover ideal compressible flow in nozzles.
Choked flow means that the flow is exactly at the speed of sound in the throat region. A higher speed cannot be achieved in the throat, regardless of upstream or downstream conditions. Thus, choked flow acts to limit how much gas flow can pass through a given size orifice, This is the reason why pressure relief valves on tanks must be properly sized to accommodate sufficient flow.
Choked flow happens for a large pressure drop across the nozzle or orifice, specifically if the upstream tank pressure meets the following condition relative to atmospheric pressure downstream from the nozzle:

Equation 5 is the origin of the rule of thumb or approximation that choked flow occurs for upstream pressure that is more than twice the value of downstream pressure (absolute). If the tank pressure drops below this limit, the speed of gas in the throat is subsonic, and less gas will flow than in the choked flow regime. The solution to subsonic flow in the nozzle is complicated and is less important to know because it is at the end of the tank’s discharge when pressure is low, and so will be neglected here.
The solution to choked flow in the throat region follows a simple relationship, derived from energy and mass balances:
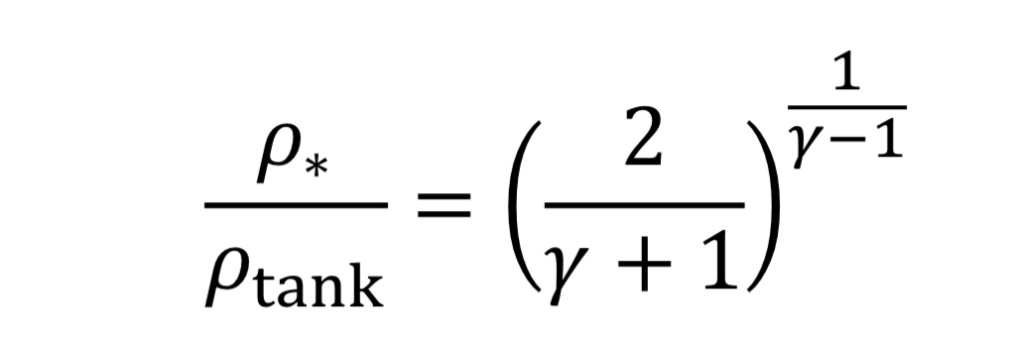
This can be substituted from Equation 3B and 4B to determine pressure and temperature in the throat in terms of tank conditions.
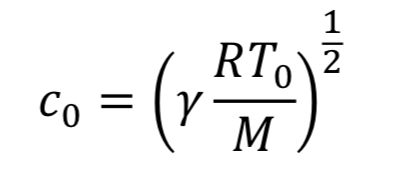
For choked flow the throat velocity is exactly the speed of sound, which is what makes it easier to analyze. For ideal gases, speed of sound, c, is determined solely by temperature. Thus, we can relate throat velocity to throat temperature, and in turn to tank temperature:

For example, if T_tank = 294 Kelvins, then c_o = 314 m/sec for air.
MASS FLOW RATE
Now we can determine the mass flow rate, “m_dot”, through the nozzle or orifice. This comes from the following standard relationship, applied at the throat, because that is where conditions are known:

where “A_*” is the throat cross-sectional area given by

and where “d_*” is throat diameter.
Dimensionless parameter, Cd, in Equation 8 is the discharge coefficient, accounting for friction between fluid and walls and a phenomenon known as vena contracta. In essence, Cd, is needed in Equation 8 because the effective area for fluid at speed, v_o, is somewhat smaller than actual throat area. Cd would be equal to 1.0 for a perfect (frictionless or thermodynamically reversible) nozzle: in practice for a smoothly tapering nozzle it might be as high as 0.98, while for a sharp-edged orifice it might be as low as 0.60. Anything that causes separation of flow from the nozzle wall or increases frictional contact will decrease Cd.
Making the appropriate substitutions into Equation 8 leads to an equation for mass flow in terms of readily determined quantities:
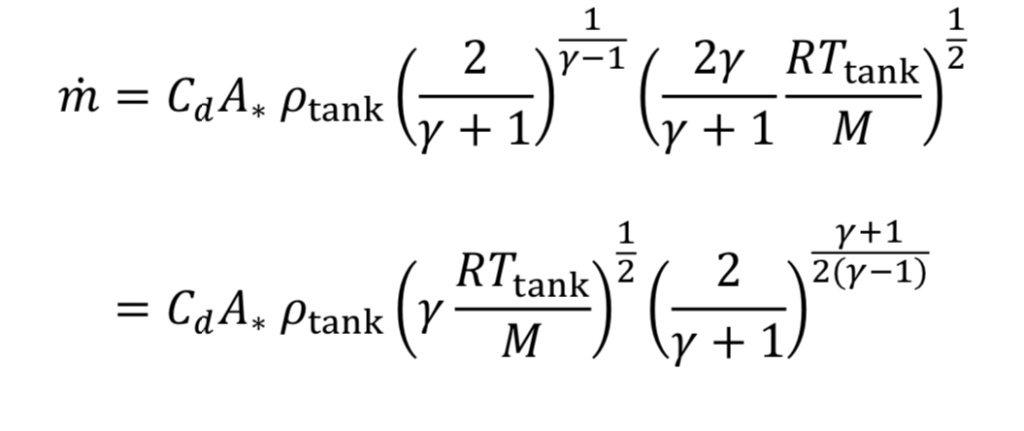
Frequently in industrial situations, mass flow rates are expressed instead as volumetric flow rates corresponding to a gas at a standard temperature and pressure (even though the gas is not actually at that temperature and pressure). For instance, a mass flow meter used for gases may express mass flow as standard liters per minute (SLPM) or standard cubic feet per minute (SCFM). In other words, even though m_dot (mass flow) is the key value being measured, it is expressed as

which requires knowing what rho_std value is programmed by the manufacturer into the flow meter. This can be determined from the ideal gas law, given specified P_std and T_std values. As an example, the American manufacturer, Omega, assumes a standard temperature “T_std” of 70 degrees Fahrenheit (294.26 Kelvins) and a standard pressure “P_std” of 1 atmosphere which equals 14.696 psia (101,325 Pscals) thus by the ideal gas law, the standard density “rho_std” would equal 1.2 kg/m3 for air (molecular weight 28.97 g/mole).
Combining Equations 10 and 11 and the ideal gas law leads to

where “c_std” is the speed of sound at the standard temperature:

Makers of valves and orifices may provide an experimentally determined size parameter known as flow coefficient, Cv. For gases this dimensionless parameter can be converted to Cd*A_* by

The key design principles resulting from the above analysis are, provided tank pressure is large enough to generate choked flow, that (1) mass flow rate of a gas through an orifice is proportional to throat area and tank pressure and (2) flow rate does not depend on downstream pressure.
TWO MODELS OF TANK BLOWDOWN
Equation 10 gives the rate of mass loss from a tank at a given gas density and temperature. To determine how long it will take to depressurize the tank, we must do a transient mass balance on the tank. The ordinary differential equation for this is:
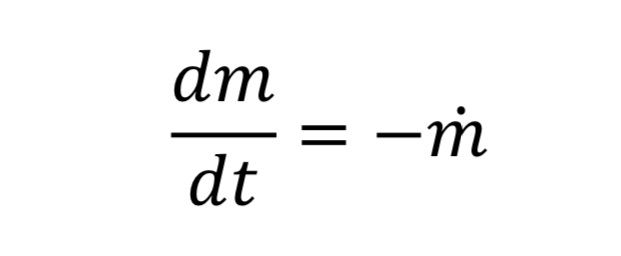
where “m_dot” comes from Equation 10 and “m” is the mass of gas in the tank. This in turn is:

where V_tank is the fixed tank volume. With these substitutions we get for the governing equation

To make things more manageable, let us create a discharge time constant called “tau”

where “c_o” is the speed of sound at the initial temperature “T_o” (i.e. at the beginning of blowdown)
With this new time constant, Equation 17 becomes:

The last thing to do before solving this equation is figure out what to do with T_tank. We have two options:
ISOTHERMAL TANK ASSUMPTIONS
Assume gas temperature in the tank does not change in time, based on blowdown taking a long time so that heat can be readily absorbed from the walls. Thus, T_tank = T_o. This leads to Equation 20 becoming

which can be separated and integrated to give the solution

where “rho_o” is initial density in the tank. We then convert densities to pressure using the ideal gas equation.

The equation tells us how tank pressure varies with time, for an isothermal tank and choked exit flow.
ADIABATIC TANK ASSUMPTIONS
Assume the gas cools as it expands in the tank, due to no heat transfer from the walls, based on the blowdown taking a short time to complete. Thus, T_tank is given by Equation 4A. This leads to Equation 20 becoming

which can be separated and integrated to give a solution.

We then convert densities to pressures using Equation 3A for adiabatic expansion.

This equation tells us how tank pressure varies with time, for an adiabatic tank and choked exit flow. The tank temperature can likewise be predicted from Equation 4A.

COMPARISON OF THE TWO MODEL ASSUMPTIONS
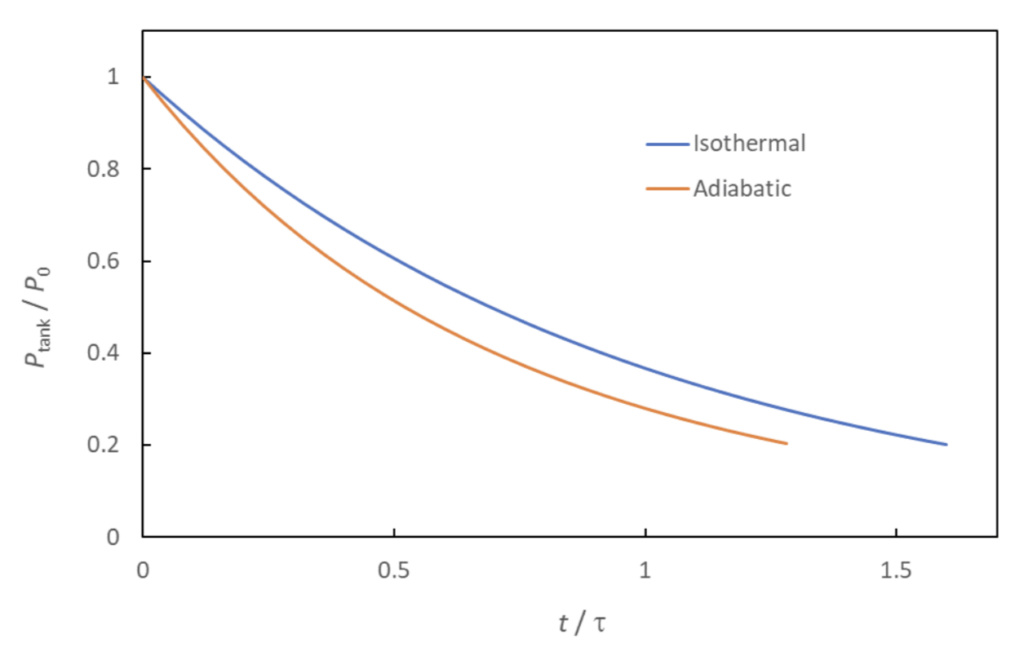
The isothermal and adiabatic models of tank blowdown can be considered two extremes, with the correct answer (i.e., with the true amount of heat transfer) lying somewhere in between them. Figure 2 shows an example of the respective blowdown curves (Equation 23 and 26). As noted previously, adiabatic tank conditions lead to more rapid pressure loss than do isothermal conditions.
The curves predict that the tank will have lost 80% of its original pressure at a time in the range of 1.3*tau < t < 1.6*tau. This shows the value of evaluating the variable, tau, to get an approximation of the time it takes to depressurize the tank.
