
by Bill Claybaugh, RRS.ORG
EDITOR’S NOTE: This is a continuation of the reporting from the 10-16-2021 flight of the 6-inch rocket design, built and flown by RRS member, Bill Claybaugh.
This project is part of an effort to develop a two-stage sounding rocket capable of sending about 5 kg of usable payload to about 200 Km altitude. This vehicle is intended to act as the upper stage of that two-stage rocket; it was—based on a systems analysis–sized for an eight second burn-time and about 1300 lbf thrust.
OVERVIEW
As flown the vehicle was 101.25” from nose tip to the fin trailing edges. The Payload section was 40.125” in length and 6.170” in diameter; the booster was 61.125” in length and 6.00” in diameter.
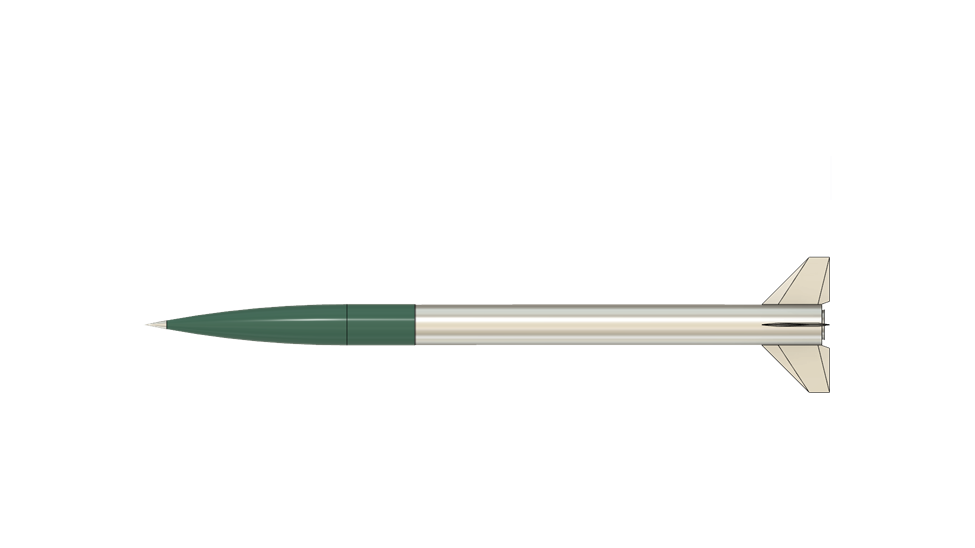
The vehicle had an aluminum nose tip, a filament wound fiberglass nose with a 5.5:1 Von Karmen profile, a filament wound cylindrical payload section, and an aluminum motor / airframe with aluminum fins.
VEHICLE DESCRIPTION
Inspection of the Forward Bulkhead showed it to be in good condition with no evidence of any gas leaks above the two O-rings. The bottom of the Bulkhead showed some damage to the fiberglass heat shield from the ground impact of the rocket but showed plenty of
Pre-flight estimated motor performance was 1350 lbsf. of thrust with a burn-time of 8.35 seconds. Burnout velocity was estimated at Mach 3.1 at 14,400 feet with a peak altitude estimated at about 71,000 feet. Total flight time was expected to be 143 seconds. The booster had a streamer attached at the forward end to try and cancel horizontal velocity upon deployment at peak, thus limiting the range of the booster.
The payload also used a streamer for recovery, it was planned to separate from the booster near peak altitude using a pneumatic separation system that operated four pins which rigidly attached the payload to the rocket until pressure was released.
Final vehicle mass properties are shown below:
| Item | Distance | Weight | Moment | C.G. | |||
| from | from | ||||||
| Nose Tip | Nose Tip | ||||||
| Nose Cone Assy. | 24.00 | 5.55 | 133.20 | Measured | |||
| Ballast | 29.90 | 0.00 | 0.00 | Estimated | |||
| Instruments Assembly | 33.00 | 8.97 | 296.01 | Measured | |||
| Bulkhead & Sep. Sys.: | 37.50 | 2.80 | 105.00 | Measured | |||
| Bolts | 38.63 | 0.03 | 1.28 | Measured | |||
| O/A Payload Length: | 40.13 | ||||||
| 17.35 | 535.49 | 30.858 | |||||
| Bulkhead Retainer | 43.04 | 1.10 | 47.34 | Measured | |||
| Bolts & Nuts | 43.41 | 0.34 | 14.59 | Measured | |||
| Bulkhead Assy. | 40.19 | 2.30 | 92.43 | Measured | |||
| Tube | 69.43 | 13.05 | 906.00 | Measured | |||
| Outer Liner | 68.31 | 4.10 | 280.08 | Measured | |||
| Fin Can | 95.10 | 2.75 | 261.52 | Measured | |||
| Nozzle | 97.49 | 7.83 | 763.31 | Measured | |||
| Bolts | 97.19 | 0.22 | 21.38 | Measured | |||
| Fins | 96.49 | 5.55 | 535.53 | Measured | |||
| Bolts | 96.19 | 0.18 | 16.93 | Measured | |||
| O/A Stage Length: | 101.25 | ||||||
| 54.77 | 3474.59 | 63.445 | |||||
| Propellant | 68.31 | 54.20 | 3702.54 | Measured | |||
| 108.97 | 7177.13 | 65.866 | |||||
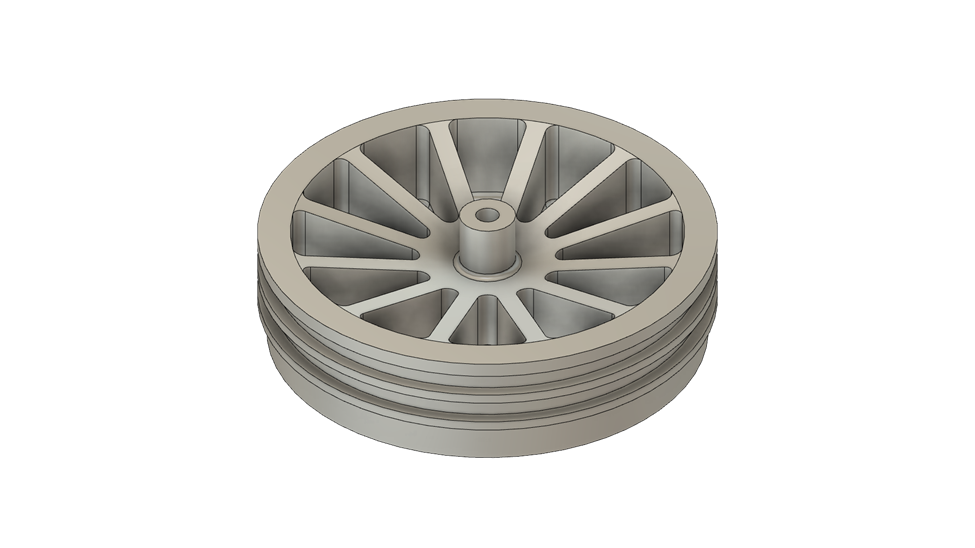
FORWARD BULKHEAD
The forward bulkhead assembly consisted of the forward bulkhead with O-rings, fiberglass spacers, and a bulkhead retainer that incorporated the bottom portion of the separation system (four holes for the attachment pins and a 45-degree bevel to allow the payload to fall off the booster once the four pneumatically operated pins retracted).

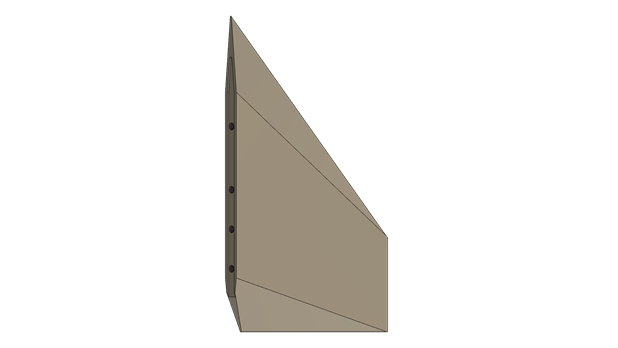
FINS
The Fins were attached to the motor tube via an internal “fin can” that served to provide the “meat” to allow four countersunk fasteners to hold each fin rigidly to the motor tube. The internal Fin Can had a single O-ring at the top to seal between the phenolic propellant liner and the fin can as wall as two O-rings to seal between the fin can and the motor wall.

Note that the fins shown are the flight fins, post flight; with the exception of minor gouging the fins appear to be fully reusable.

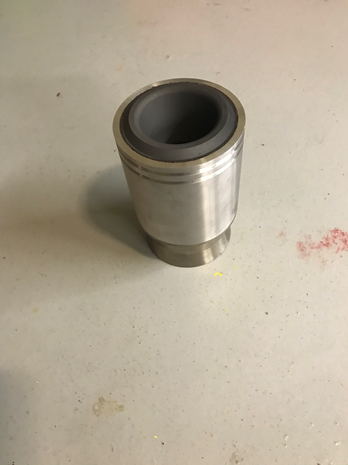
NOZZLE
The nozzle consisted of an aluminum outer shell, a graphite insert, and a stainless steel nozzle extension with a plasma sprayed Zirconia overcoat on the inside diameter.

PROPELLANT LINER
The liner protecting the motor tube from the combustion gas was a phenolic tube with a 5.50 inch inside diameter. The tube was originally slightly oversize for the motor tube’s 5.75” nominal inside diameter and was sanded as necessary to make it a tight slip fit into the motor tube. It was then cut to a 48” overall length and fitted to the motor tube using a high temperature grease (550 degrees F).
Post-flight analysis shows that the liner had about 0.090” – 0.092” of the original 0.125” wall remaining in those areas exposed to hot gas throughout the burn; note that heating of the phenolic leads to expansion of the thickness of the liner, nonetheless, there was no evidence of hot gas having reached the motor tube wall.
PROPELLANT
The grain was cast in place using a dissolvable (polystyrene) mandrel that provided for four fins at the base of the motor and a simple cylindrical core at the upper end. This grain design provided an approximately neutral thrust curve as the finocyl section regressed in burn area at a rate that very closely matched the progression of the cylindrical section of the grain.


The finocyl section at the base of the grain was 14.75” in length, the cylindrical section 31.25” in length for an overall 46” propellant grain length.
Because the grain design tools used for this project worked only in two dimensions, the 2.66 square inches of exposed grain surface at the top of the finocyl fins was not modeled in the simulation. This represents 0.80% of the initial grain burn area and, accordingly, the actual performance was expected to be slightly regressive.
All grain design simulations were based on the 0.056 lbsm / cubic inch propellant density of the various static test motors; in the event, this grain came in at 0.059 lbsm / cubic inch due to changes in both the propellant mix and processing. The effects of that higher density on flight performance will be addressed in the Analysis section.
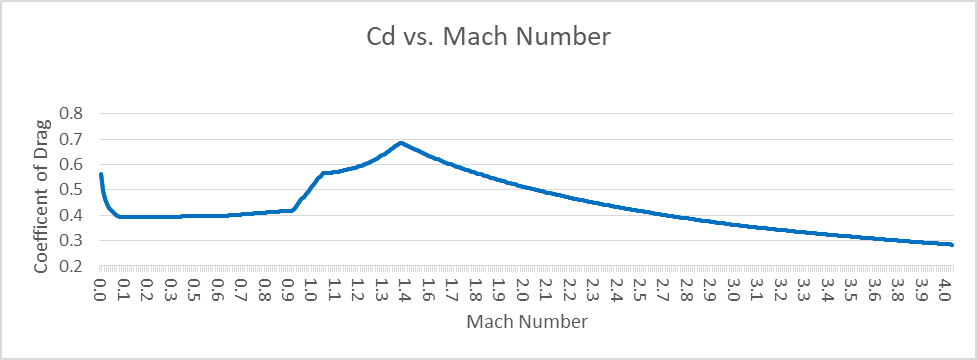
AERODYNAMIC MODEL
Most dynamical simulations for this flight were conducted using RASAero II. The aerodynamic model estimated by that tool is shown below:
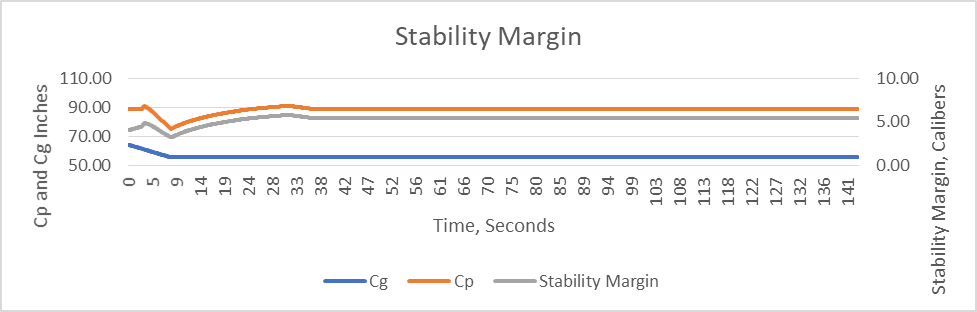
Likewise, RASAero II provided estimates of Stability Margin over the flight profile:
A splash analysis was very graciously conducted by Chuck Rogers. That analysis concluded that the initial launch conditions that minimized risk to the uninvolved public were a launch azimuth of 244 degrees and a launch tower angle of 87 degrees (that is, three degrees below vertical in a southwesterly direction).
PAYLOAD
The payload consisted of three subsystems: a pneumatic payload separation system, a main flight computer with integrated transmitter, and, a backup flight computer with onboard recording of flight engineering data.
PNEUMATIC SEPARATION SYSTEM
The separation system relied on four pins that rigidly locked the payload to the vehicle. The system was actuated by command from the main or backup flight computers, which command fired a nitrocellulose-based initiator that in turn drove a plunger through a burst disk. Venting of the system allowed spring force on the four locking pins to draw them inward, thus allowing the payload to fall away from the booster.
The Separation System was o-ring sealed at all connections to assure it remained leak free under flight conditions. Initial testing showed the system could hold pressure (125 psia air) for 100 hours. Pre-flight testing included a 50-hour leak down test followed by one minute on a shake table. The unit was leak free and actuated on command after this final test.
The main flight data recorder and transmitter was a Multitronix Kate 2 System; backup flight data recording was provided by an Altus Metrum EasyMega.


MAIN FLIGHT COMPUTER
The main flight computer was a Kate 2 Data Recorder and Transmitter from Multitronics, Inc. This system used a 915 MHz ISM uplink and downlink with on-the-fly adjustable power output from 100 mw to 1 watt, it used Spread Spectrum Frequency Hopping and FSK Modulation with a 128-bit AES encryption.
The system fixes its GPS position every 200 msec and features unlimited GPS altitude reporting; the velocity lockout is at 1700 ft/sec. A 50 g Axial Acceleremeter and 10 g pitch and yaw accelerometers record every 10 msec and report via telemetry every 100 msec. A separate pyro board initiates payload separation and peak.
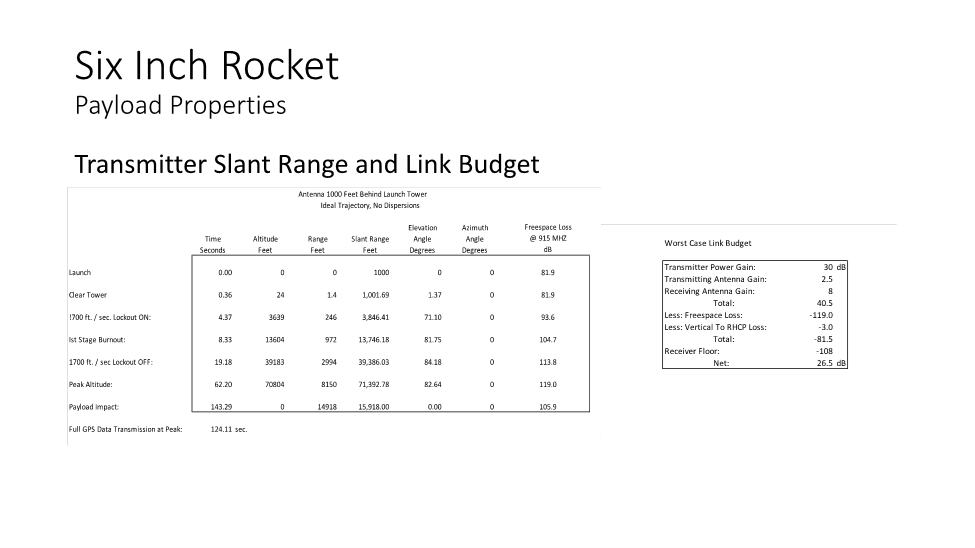
The transmitter link budget indicates a worse case net 26.5 dB at the receiver for this flight.
BACKUP FLIGHT COMPUTER
The backup flight computer was an Altus Metrum EasyMega with three axis data recording (acceleration and rates) and a barometric altitude estimator. Separate batteries and switches powered the independent pyro initiation which was programed for one second after the accelerometer measured peak altitude.
FLIGHT SIMULATION MODEL
Simulation using RASAero II showed an estimated peak altitude of about 71,000 feet, a worse case total flight time of about 144 seconds (assuming no separation at peak), and a maximum worst-case range of about 75,000 feet.

Baseline flight simulation (from RASAero II):

Launch Angle Vs. Range (from RASAero II):

Maximum Range Estimation (from RASAero II):
FLIGHT TEST RESULTS
Based on video analysis, ignition require 0.067 seconds from the rupturing of the burst diaphragm (a standard 1.5” rubber stopper previously tested to pass the nozzle at 40-50 psia) to first motion. From first motion, it required 0.35 seconds to clear the 24-foot tower at about 25 feet altitude and about 165 ft/sec.
Frame-by-Frame Video Analysis
(Red Indicates Clearing the Tower)
| Estimated | ||||||
| Cumulative | Estimated | |||||
| Frame | Estimate | Estimate | Estimated | Estimated | Average | Interval |
| Number | Burn | Flight | Vertical | Vertical | Vertical | Vertical |
| Time | Time | Motion | Velocity | Acceleration | Acceleration | |
| (ft.) | (ft./sec.) | (g’s) | (g’s) | |||
| 1 | 0.017 | 0.000 | 0.00 | |||
| 2 | 0.033 | 0.000 | 0.00 | |||
| 3 | 0.050 | 0.000 | 0.00 | |||
| 4 | 0.067 | 0.017 | 0.50 | 60.00 | 110.80 | 110.80 |
| 5 | 0.083 | 0.033 | 1.00 | 60.00 | 54.90 | -1.00 |
| 6 | 0.100 | 0.050 | 2.00 | 80.00 | 48.69 | 36.27 |
| 7 | 0.117 | 0.067 | 2.50 | 75.00 | 33.94 | -10.32 |
| 8 | 0.133 | 0.083 | 2.75 | 66.00 | 23.60 | -17.77 |
| 9 | 0.150 | 0.100 | 3.00 | 60.00 | 17.63 | -12.18 |
| 10 | 0.167 | 0.117 | 4.00 | 68.57 | 17.25 | 14.97 |
| 11 | 0.183 | 0.133 | 5.00 | 75.00 | 16.47 | 10.98 |
| 12 | 0.200 | 0.150 | 5.00 | 66.67 | 12.80 | -16.53 |
| 13 | 0.217 | 0.167 | 8.00 | 96.00 | 16.89 | 53.66 |
| 14 | 0.233 | 0.183 | 8.50 | 92.73 | 14.71 | -7.10 |
| 15 | 0.250 | 0.200 | 10.00 | 100.00 | 14.53 | 12.55 |
| 16 | 0.267 | 0.217 | 12.00 | 110.77 | 14.88 | 19.07 |
| 17 | 0.283 | 0.233 | 14.00 | 120.00 | 14.97 | 16.20 |
| 18 | 0.300 | 0.250 | 17.50 | 140.00 | 16.39 | 36.27 |
| 19 | 0.317 | 0.267 | 19.50 | 146.25 | 16.03 | 10.65 |
| 20 | 0.333 | 0.283 | 22.00 | 155.29 | 16.02 | 15.85 |
| 21 | 0.350 | 0.300 | 25.00 | 166.67 | 16.25 | 20.19 |
| 22 | 0.367 | 0.317 | 28.00 | 176.84 | 16.34 | 17.96 |
| 23 | 0.383 | 0.333 | 31.00 | 186.00 | 16.33 | 16.06 |
| 24 | 0.400 | 0.350 | 33.00 | 188.57 | 15.73 | 3.79 |
| 25 | 0.417 | 0.367 | 36.00 | 196.36 | 15.63 | 13.52 |
| 26 | 0.433 | 0.383 | 40.00 | 208.70 | 15.91 | 21.98 |
| 27 | 0.450 | 0.400 | 42.00 | 210.00 | 15.30 | 1.43 |
| 28 | 0.467 | 0.417 | 46.50 | 223.20 | 15.64 | 23.60 |
| 29 | 0.483 | 0.433 | 54.00 | 249.23 | 16.86 | 47.50 |
| 30 | 0.500 | 0.450 | 57.00 | 253.33 | 16.48 | 6.64 |
| 31 | 0.517 | 0.467 | 61.00 | 261.43 | 16.40 | 14.08 |
| 32 | 0.533 | 0.483 | 64.50 | 266.90 | 16.15 | 9.19 |
| 33 | 0.550 | 0.500 | 69.00 | 276.00 | 16.14 | 15.96 |
| 34 | 0.567 | 0.517 | 73.00 | 282.58 | 15.99 | 11.26 |
| 35 | 0.583 | 0.533 | 76.50 | 286.88 | 15.70 | 7.00 |
| 36 | 0.600 | 0.550 | 85.00 | 309.09 | 16.45 | 40.40 |
| 37 | 0.617 | 0.567 | 90.00 | 317.65 | 16.41 | 14.94 |
| 38 | 0.633 | 0.583 | 94.00 | 322.29 | 16.16 | 7.64 |
| 39 | 0.650 | 0.600 | 97.50 | 325.00 | 15.82 | 4.06 |
| 40 | 0.667 | 0.617 | 102.50 | 332.43 | 15.74 | 12.85 |
| 41 | 0.683 | 0.633 | 110.50 | 348.95 | 16.11 | 29.77 |
| 42 | 0.700 | 0.650 | 115.00 | 353.85 | 15.91 | 8.13 |
| 43 | 0.717 | 0.667 | 119.50 | 358.50 | 15.70 | 7.67 |
| 44 | 0.733 | 0.683 | 123.50 | 361.46 | 15.43 | 4.52 |
| 45 | 0.750 | 0.700 | 128.00 | 365.71 | 15.23 | 6.92 |
| 46 | 0.767 | 0.717 | 132.50 | 369.77 | 15.02 | 6.55 |
| 47 | 0.783 | 0.733 | 141.00 | 384.55 | 15.29 | 26.54 |
| 48 | 0.800 | 0.750 | 145.00 | 386.67 | 15.01 | 2.95 |
| 49 | 0.817 | 0.767 | 150.00 | 391.30 | 14.85 | 7.64 |
| 50 | 0.833 | 0.783 | 158.00 | 403.40 | 14.99 | 21.55 |
Just after 0.50 seconds the vehicle began an unplanned turn to the Northeast. This turn continued for 0.25 seconds before the vehicle resumed stable flight on the new azimuth and with a flight path angle of about 75 degrees. After 0.80 seconds but before 1.0 seconds, the telemetry failed. The cause of this failure is not yet established but appears to the manufacturer to have been a power outage; however, the battery was still connected to the main computer after recovery and the battery tested at an optimal 3.87 volts.
At about 1.0 seconds, the payload separation system appears to have been actuated by the backup flight computer; that computer is currently at the manufacture for data extraction to try and determine why it fired the initiators.
Based on video analysis, the vehicle appears to have coned twice following separation of the payload. This coning could have been associated with the payload separation or with the deployment of the rocket’s streamer. In either case, the vehicle resumed stable flight (as designed) without a nose cone. The payload assembly was located about 120 feet from the launch tower on the northeasterly azimuth. The backup flight computer was still actively reporting (via “beeps”) it’s status but the main computer was not so doing.


The booster was located north and a little east of the launch site at a range of 14,300 feet. Based on that range and the estimated motor performance a trajectory reconstruction suggests a maximum altitude of 21,200 feet, a burnout velocity of 1550 ft/sec and a terminal velocity of about 820 ft/sec with a total flight time of about 74.5 seconds.
The booster impact left an about 2.0-inch-deep depression in the hardpan before the hardware apparently fell on its side. Given an estimated terminal velocity of 820 ft/sec, this implies and average of 410 ft/sec to stop and thus that the vehicle came to rest in about 0.000407 seconds. This in turn indicates an average deceleration of about 31,200 g’s on impact.
ANALYSIS – THE TURN TO THE NORTHEAST
The Turn to the Northeast
All testable reasons for the turn to the Northeast after 0.50 seconds have been ruled out: there was no hot gas leak nor any apparent disturbance to the thrust vector. The wind was from the Northwest and less than 5 mph, if it had caused the turn we would have expected the vehicle to turn toward the Northwest, not the Northeast. The temporary “hanging” of a part of the bellybands appears ruled out by the absence of any gap between the fins and the motor tube as well as by the absence of any damage to the fin leading edges. Further, the bellybands all landed within fifty feet of the launch tower; given an estimated velocity of about 165 ft/sec at the top of the tower, this implies that each bellyband followed a nearly vertical trajectory following clearing the tower.
The remain hypothesis for the cause of this turn is that the vehicle ran into a “dust devil” that was not visible because it had not reached the ground. Examination of the video using polarized glasses showed no evidence for such an event, but that is not conclusive as the sun angles may have been inappropriate for this technique.
ANALYSIS – TELEMETRY FAILURE
Telemetry failed after 0.80 seconds but before 1.0 seconds based on analysis by the manufacturer of data recorded by the receiver (data packets are sent every 0.2 seconds, one was received at about 0.80 seconds and no subsequent packets were recorded). The cause of this failure is unclear: the manufacturer has initially concluded it was a power failure, however, the battery showed 3.8 volts at recovery and was still connected to the computer / transmitter; thus, a power failure would have to have been internal to the hardware. This failure might be associated with separation of the payload from the rocket which occurred around this time. Transmitted data show that the main computer did not initiate the separation and had continuity to the initiator throughout the period during which data was transmitted.
ANALYSIS – PREMATURE PAYLOAD SEPARATION
The payload was recovered about 120 feet from the launcher on a Northeasterly heading. Based on the location a trajectory reconstruction suggests separation may have occurred around 1.0 seconds into the flight at about 400 feet altitude.
Given the data indicating that the main computer did not command separation while it was operating and the observation, following recovery, that both initiators had been fired (firing of either initiator ignites the other), it appears that the backup computer may have initiated the separation. That computer is currently at the manufacturer for repairs after which we hope to extract whatever data it may have recorded, including continuity data with respect to the initiator to which it was wired.
SUBSEQUENT FLIGHT
Following payload separation, the vehicle appears to have coned twice and then resumed stable flight on the new heading. Upon recovery, the vehicle did not have its streamer attached and we assume it was lost to aerodynamic forces during the separation of the payload and subsequent coning; however, that streamer has not been recovered and so we cannot confirm when it came off the vehicle.
Per the trajectory estimate, it appears that even with a blunt front end, the vehicle may have reached around Mach 1.35 (1550 ft. / sec.) but that estimate is unconfirmed.
Note that the video measured velocity and acceleration up the launch tower was noticeably higher than the pre-flight estimate: pre-flight, velocity at the top of the tower was estimated at about 145 ft / sec while the measured velocity just after clearing the tower was about 165 ft / sec. This difference may be due to the higher density of the propellant as compared to the pre-flight model; assuming that the ballistic characteristics of the propellant remained the same (very unlikely) modeling of the pre-flight propellant assumptions but using the higher density indicates it would produce about 5% higher thrust at about 8% higher chamber pressure due to the higher mass flow compared to the pre-flight modeled propellant.
Modelling of the vehicle performance using the actual range and these different propellant performance assumptions does not significantly change the estimated peak altitude or velocity: the somewhat greater energy of the flight propellant is spent on increased drag as velocity approaches Mach 1.35.
SUMMARY AND FUTURE WORK
The rocket motor appears to have performed as designed, albeit in off-design flight conditions. In the absence of any explanation for the unplanned turn to the Northeast, no changes to the motor design are planned for the next flight vehicle other than the hard anodizing of the fins to help them survive future flights to still higher velocities.
The payload assembly appears to have been commanded off the rocket motor at about one second into the flight; the reason for this remains unclear at this writing. For future flights the internal payload structure will be made still more robust to prevent the internal structural failures that did occur upon impact of the payload; some of those structures will be rebuilt in stainless steel to help move the Cg forward (this was not an issue for this flight, but will be for eventual Mach 6 burnout velocities).
Further work is required on the base of the launch tower to significantly reduce the labor required to assemble and erect the tower.
The bellybands will be modified for greater strength and spring back by moving to 1095 spring steel instead of the 2024T-3 used for this flight; in addition, the guides will be lightened both to aid travel up the rail and to mitigate against any impact damage that might occur if they contact the vehicle during separation.