
The Two Stage Cluster
Flight Report
by Bill Claybaugh
Introduction
On 17 October, 2009 a two stage rocket consisting of a cluster of four standard RRS “class” motors in the first stage and a single “class” motor for the second stage (Figure 1) was flown at the Mojave Test Area. Pre-flight modeling suggested a peak altitude of about 45,000 feet and a maximum velocity of about Mach 2.5. Available data indicate that a partial failure of the nose cone attachment resulted in “cocking” of the nose cone and subsequent “coning” of the vehicle as it accelerated. The coning in turn resulted in a trajectory that headed approximately southeastwardly rather than in the planned southwest (downrange) direction. Analysis of video of the second stage burn allows the performance of the rocket to be constrained to a probable burnout velocity above 1700 feet / second at about 6900 feet altitude. Six DOF modeling suggests a maximum altitude of at least 13,000 feet.

Figure 1
Vehicle Design
The motor cluster for the first stage relied on through-the-wall attachment of the fins and the aerodynamic transitions at the base of the rocket, as well as for attaching two identical central tube cluster attachment parts at the top and bottom of the stage (Figure 2). A conical to rounded-square transition at the top of the first stage consisted of a base section and the conical to round transition piece. All parts were 6061-T6 Aluminum.

Figure 2
Ignition of the first stage was via four head end igniters. An 18 gauge “spider” allowed parallel ignition of all four motors from the two-prong pull-away ignition lead.
The second stage was a slip fit (0.004” clearance) into the first stage transition to facilitate the planned aerodynamic separation of the two stages following first stage burnout. As with the first stage, the fins were attached via through-the-wall fasteners.
The payload was attached via an interference fitted (a 0.063” o-ring was used to create the interference fit) inner and outer cylinder with the inner cylinder fitted to the second stage. Payload separation was planned for near peak altitude via a black powder charge ignited via an R-DAS flight computer with 3-axis acceleration measurement.
Flight Performance
All four motors appear to have ignited within tens of milliseconds of each other (Figure 3). Still imagery shows the vehicle clearing the launcher in the as designed configuration. Low resolution still imagery taken at about 30 feet altitude (Figure 4) shows an apparent “cocking” of the nose cone in the “up range” (westerly) direction. Another image taken at about 70 feet altitude shows the “cocked” nose cone on the opposite side of the vehicle (Figure 5). Assuming that this cocking of the nose cone is real (and not a smeared image caused by a slow digital camera combined with vehicle motion), we can conclude that the vehicle has rotated about 180 degrees between the two images. Video imagery of the same period of the flight plainly shows the vehicle “swimming” from the right side of the image to the left in a manner that is consistent with aerodynamic forces producing a “coning” of the vehicle as it rotates with the partially failed nose cone exposed to different sides of the airflow as the rocket accelerates.

Figure 3

Figure 4

Figure 5
Video of the rocket’s flight records the difference between the visual ignition of the first stage and the arrival of the sound. That difference results in a 911 foot estimate of the distance between the launcher and the camera assuming 1125 feet / second for the speed of sound in cool, dry air. The actual distance between the launcher and the camera location is measured as 984 feet from Google Earth. The first stage burn out is very difficult to discern in the video due both to a long tail-off of the smoke trail and to a significant amount of apparently aerodynamically generated noise following first stage burnout. Pre flight simulation suggested that the relatively high drag associated with the first stage design would result in aerodynamic separation of the second stage about 1.95 seconds into the 2.2 second burn of the motors due to the thrust tail-off falling below the net deceleration of the vehicle. The video is not of sufficient resolution to determine if the second stage did in fact separate following first stage burnout.
Second stage ignition was planned for five seconds after sensed first stage burnout. Counting of frames from the video indicates that the second stage in fact ignited 4.9 seconds after first stage ignition. This is evidently a consequence of a failure to correctly program at least one of the dual redundant staging delay timers.
A high resolution still video image of the second stage in flight clearly shows the glowing nozzles of the first stage slightly to the side of the second stage smoke trail; based on the location of the first stage, it appears likely that the second stage in fact separated from the first stage prior to second stage ignition.
The second stage appears to have continued “coning” throughout the second stage burn. This is most evident in images of the smoke trail which show two very obvious “screws” a few seconds after second stage ignition (presumably due to thermal expansion of the smoke, thus revealing the original much tighter “coning”). The pattern of the smoke trail suggests that the second stage spin rate increased over the course of the burn, as would be expected. This behavior further suggests that the nose cone was in fact offset by a partial failure of the attachment.
Both second stage ignition and burnout have clear audio signals on the flight video. This data suggests that the second stage was about 4175 feet from the camera at ignition and about 6950 feet from the camera at burnout, assuming 1125 feet / second for the speed of sound.
An examination of the geometry of the second stage burn allows some constraints to be place on the vehicle’s performance during this period (Figure 6).
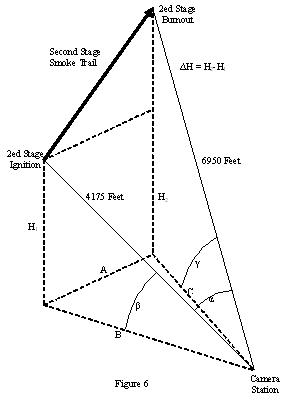
Figure 6
Initial video of the flight shows both the launcher and the Laboratory building at the MTA. Google Earth indicates the distance between these two to be about 206 feet. As noted previously, the same tool shows a distance of 984 feet between the camera location and the launcher; it also shows 856 feet between the camera location and the visible forward corner of the lab building. Including variance associated with multiple measurements of these dimensions, the included angle between the launcher and the lab building must be between 9.65 degrees and 10.63 degrees as seen on the video image. Given this data, the angular dimensions of the video frame (the Field of View) can be estimated at between 27.8° by 20.8° and 30.6° by 23.0? (Horizontal by Vertical). We assume that the larger angular dimensions represent the circular field of view of the camera, which is truncated in the image by the aspect ratio of the imaging system.
Given the camera Field of View, it is possible to estimate the included angle of the second stage smoke trail. Thus, if the smoke trail is measured as 2.62” in length on a projection in which the horizontal dimension is 9”, then if the 9” dimension corresponds to a 30.6° FOV, the smoke trail must be 8.9° in angular dimension. This analysis indicates that the included angle of the smoke trail is between 8.1° and 8.9° as seen from the camera (this is the angle ? in Figure 6).
Given this estimate and the “acoustic” range measurements, we can in turn estimate the smoke trail length as between 2875 and 2900 Feet. Since this distance was traversed in the course of the 2.2 seconds burn time of the second stage (measured from the video), we can further estimate that the average velocity during the second stage burn was between 1300 and 1320 feet per second. If we adjust the “acoustic” range measurements to reflect the difference between the 984 feet launcher to camera distance and the “acoustic” measurement of 911 feet, then the smoke trial length would be between 3090 and 3135 feet and the resulting average velocity between 1400 and 1425 feet / second.
Pre-flight simulation suggests that the velocity split between the two stages was about one-half. If we assume this applies to the off-design conditions of the actual flight, we might conclude that the initial velocity at second stage ignition would have been about 867 and the final velocity at burnout about 1733 feet / second in order to produce an average velocity of 1300 feet second. For the “adjusted” average velocity of 1400 feet / second, this would produce and initial velocity of 933 feet / second and a final velocity of about 1867 feet / second.
Because observers estimated the second stage flight as having passed nearly directly overhead at the camera position, it is possible to constrain the camera angles (?, ?) at the beginning and end of the second stage burn to above 75 degrees. In addition, we can assume that the angle at the end of burn (?) was higher than the angle at the beginning of burn (?), since the distance between the camera and the vehicle increased over the course of the burn (Table 1).
Analysis of the estimates in Table 1 suggests that the flight path angle was most likely between 70 ? and 80 ? above the horizon during the second stage burn. This estimate can then be used to model the 6-DOF flight path and constrain the possible impact points of both the first and second stages.
Post flight 6-DOF simulation based on these estimates suggests the first stage impacted about 2150 feet from the launcher. The second stage would then have reached between 13,000 and 15,500 feet altitude and impacted about 8775 feet from the launcher. Initial searching in the area of the estimated first stage impact failed to turn up any evidence; a more extensive search is planned in future.

Table 1: Vehicle Flight Path Geometric Constraints
In the absence of the actual impact points for the first and/or second stages, it is not possible to further constrain the flight parameters of this vehicle. At this point we can only estimate that—despite significant induced aerodynamic drag due to the “coning” —it’s burnout velocity was probably above Mach 1.5 at about 6950 feet and that it may have exceed 13,000 feet in altitude.